logback & mdc in spring

- Published on
- /30 mins read/
A practical deep-dive into building observable microservices — the patterns, pitfalls, and production-tested solutions.
# introduction: the log that told te nothing
Picture this: It's 2 AM. PagerDuty just woke you up. Your e-commerce platform is dropping orders. You SSH into the production server, tail the logs, and see something like this:
2024-03-15 02:01:33.421 ERROR PaymentService - Payment processing failed
2024-03-15 02:01:33.422 ERROR OrderService - Order creation failed
2024-03-15 02:01:33.423 WARN  InventoryService - Stock check timeout
2024-03-15 02:01:33.424 ERROR PaymentService - Payment processing failed
2024-03-15 02:01:33.425 ERROR OrderService - Order creation failed
Which payment failure caused which order failure? Which user was affected? Was the inventory timeout related to the payment error, or was it a completely different request? You have no idea. The logs are technically correct but practically useless.
This is the reality of logging in distributed systems without proper correlation. And this is exactly the problem that MDC (Mapped Diagnostic Context) and distributed tracing solve.
In this article, I'll walk you through everything I've learned about building observable Spring Boot microservices — from the fundamentals of MDC to production-grade distributed tracing setups. This isn't theoretical. Every pattern here has been battle-tested in systems handling millions of requests per day.
# understanding the problem space
# why traditional logging breaks in microservices
In a monolithic application, a single request flows through one process. You can use thread-based logging, and everything makes sense. But in microservices:
- A single user action triggers calls across 5, 10, or even 20 services
- Each service has its own log stream
- Requests are processed concurrently — logs from different requests interleave
- Asynchronous processing (message queues, event-driven patterns) breaks the linear flow
- Auto-scaling means logs are spread across multiple instances of the same service
Without correlation, debugging becomes a nightmare of grep, timestamps, and guesswork.
# what we need
A good observability strategy for microservices requires:
- Request Correlation: Every log line from a single request should share a unique identifier
- Cross-Service Tracing: That identifier should propagate across service boundaries
- Causal Ordering: We should be able to reconstruct the exact flow of a request
- Low Overhead: The tracing mechanism shouldn't significantly impact performance
- Transparency: Application code shouldn't need to explicitly pass trace IDs around
This is where MDC and distributed tracing come in.
# logback fundamentals — beyond the basics
# why logback?
Spring Boot uses Logback as its default logging framework, and for good reason:
- Performance: Logback is significantly faster than Log4j 1.x and competitive with Log4j2
- Native SLF4J support: No bridging needed
- Powerful configuration: Conditional processing, filters, and dynamic reloading
- First-class MDC support: Built into the core architecture
# logback architecture in 60 seconds
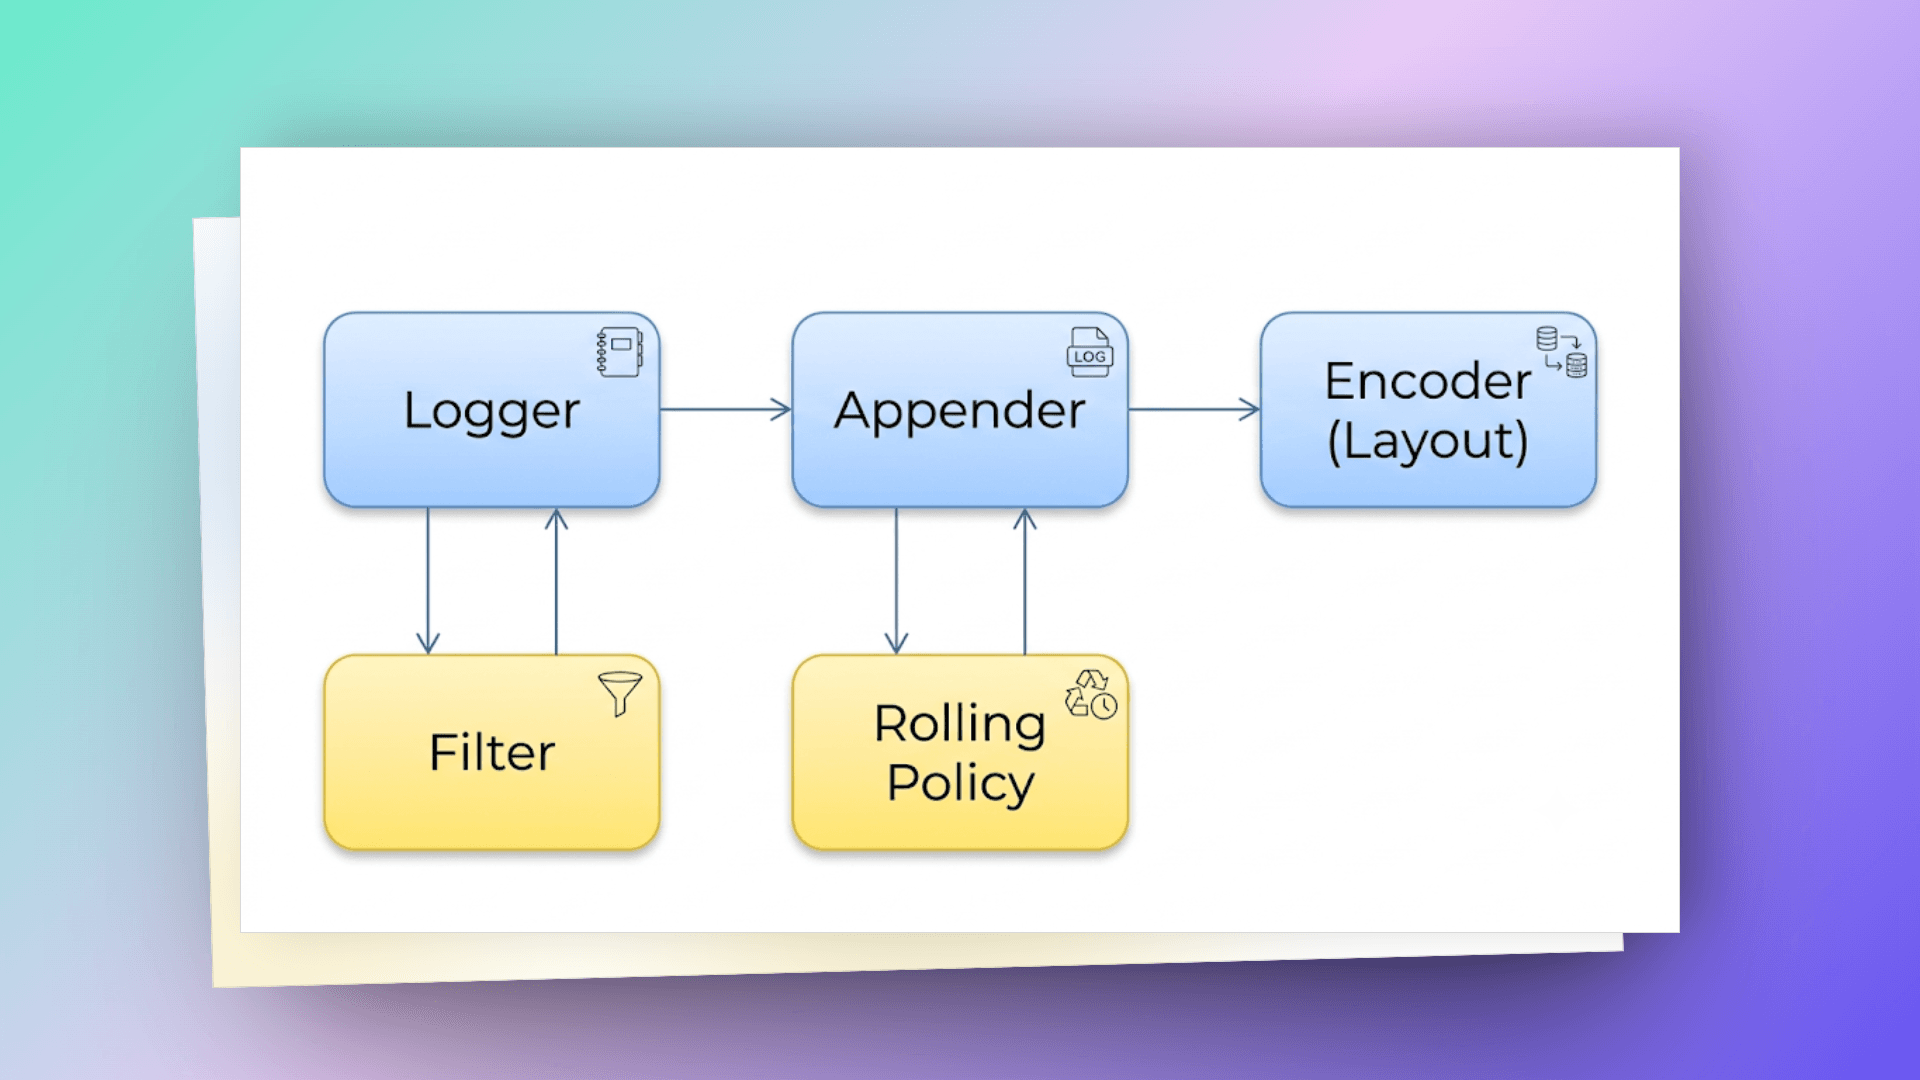
- Logger: Named entity that captures log events (e.g.,
com.myapp.service.OrderService) - Appender: Destination for log events (console, file, network)
- Encoder/Layout: Formats the log event into a string or byte array
- Filter: Decides whether a log event should be processed
- Rolling Policy: Manages log file rotation
# a production-ready logback-spring.xml
Most tutorials show you a 5-line Logback config. Here's what a real production config looks like:
<?xml version="1.0" encoding="UTF-8"?>
<configuration scan="true" scanPeriod="30 seconds">

   <!-- Properties -->
   <springProperty scope="context" name="APP_NAME" source="spring.application.name"
                   defaultValue="unknown-service"/>
   <springProperty scope="context" name="APP_ENV" source="spring.profiles.active"
                   defaultValue="local"/>

   <property name="LOG_PATH" value="${LOG_PATH:-./logs}"/>
   <property name="LOG_PATTERN"
             value="%d{yyyy-MM-dd HH:mm:ss.SSS} [%thread] [%X{traceId:-}] [%X{spanId:-}] [%X{requestId:-}] %-5level %logger{36} - %msg%n"/>
   <property name="JSON_LOG_PATTERN"
             value='{"timestamp":"%d{yyyy-MM-dd HH:mm:ss.SSS}","level":"%level","thread":"%thread","traceId":"%X{traceId:-}","spanId":"%X{spanId:-}","requestId":"%X{requestId:-}","logger":"%logger{36}","message":"%msg","service":"${APP_NAME}","env":"${APP_ENV}"}%n'/>

   <!-- Console Appender - Human readable for local dev -->
   <springProfile name="local,dev">
       <appender name="CONSOLE" class="ch.qos.logback.core.ConsoleAppender">
           <encoder>
               <pattern>${LOG_PATTERN}</pattern>
           </encoder>
       </appender>
   </springProfile>

   <!-- Console Appender - JSON for production (structured logging) -->
   <springProfile name="staging,production">
       <appender name="CONSOLE" class="ch.qos.logback.core.ConsoleAppender">
           <encoder>
               <pattern>${JSON_LOG_PATTERN}</pattern>
           </encoder>
       </appender>
   </springProfile>

   <!-- File Appender with Rolling -->
   <appender name="FILE" class="ch.qos.logback.core.rolling.RollingFileAppender">
       <file>${LOG_PATH}/${APP_NAME}.log</file>
       <rollingPolicy class="ch.qos.logback.core.rolling.SizeAndTimeBasedRollingPolicy">
           <fileNamePattern>${LOG_PATH}/${APP_NAME}.%d{yyyy-MM-dd}.%i.log.gz</fileNamePattern>
           <maxFileSize>100MB</maxFileSize>
           <maxHistory>30</maxHistory>
           <totalSizeCap>3GB</totalSizeCap>
       </rollingPolicy>
       <encoder>
           <pattern>${LOG_PATTERN}</pattern>
       </encoder>
   </appender>

   <!-- Async wrapper for FILE appender -->
   <appender name="ASYNC_FILE" class="ch.qos.logback.classic.AsyncAppender">
       <queueSize>512</queueSize>
       <discardingThreshold>0</discardingThreshold>
       <includeCallerData>false</includeCallerData>
       <appender-ref ref="FILE"/>
   </appender>

   <!-- Root Logger -->
   <root level="INFO">
       <appender-ref ref="CONSOLE"/>
       <appender-ref ref="ASYNC_FILE"/>
   </root>

   <!-- Application-specific logging -->
   <logger name="com.myapp" level="DEBUG" additivity="false">
       <appender-ref ref="CONSOLE"/>
       <appender-ref ref="ASYNC_FILE"/>
   </logger>

   <!-- Reduce noise from frameworks -->
   <logger name="org.springframework" level="WARN"/>
   <logger name="org.hibernate" level="WARN"/>
   <logger name="org.apache.kafka" level="WARN"/>
   <logger name="io.netty" level="WARN"/>

</configuration>
Key things to notice:
%X{traceId:-}: This is MDC in action — we'll dive deep into this- Spring Profile-based config: JSON in production, human-readable locally
- AsyncAppender: Critical for performance — logging shouldn't block your business logic
discardingThreshold=0: Don't drop any logs, even under pressure (adjust based on your needs)scan=true: Allows changing log levels at runtime without restart
# mdc deep dive — the secret weapon
# what is mdc?
MDC (Mapped Diagnostic Context) is essentially a thread-local Map<String, String> managed by the logging framework. Any key-value pair you put into MDC is automatically available in your log pattern via %X{key}.
Think of it as invisible metadata that travels with every log statement on the current thread — without you having to pass it as a parameter.
# the mdc api
import org.slf4j.MDC;

// Put a value
MDC.put("requestId", "abc-123");

// Get a value
String requestId = MDC.get("requestId");

// Remove a value
MDC.remove("requestId");

// Clear all values
MDC.clear();

// Get a copy of the entire context map
Map<String, String> contextMap = MDC.getCopyOfContextMap();

// Set the entire context map (useful for propagation)
MDC.setContextMap(contextMap);
# How mdc works under the hood
Logback's MDC implementation uses ThreadLocal<Map<String, String>>:
Thread-1: MDC Map = {"requestId": "abc-123", "userId": "user-456"}
Thread-2: MDC Map = {"requestId": "def-789", "userId": "user-012"}
Thread-3: MDC Map = {} (empty)
When Logback processes a log event, it captures a snapshot of the current thread's MDC map. The %X{key} pattern in your layout reads from this snapshot.
This is both MDC's superpower and its Achilles' heel:
- Superpower: Zero-effort context propagation within a thread
- Achilles' heel: Context is lost when work moves to a different thread (thread pools, async operations, reactive streams)
# mdc lifecycle management — the #1 mistake
The most common MDC bug is forgetting to clean up:
// ❌ BAD: MDC leak
public void processOrder(Order order) {
   MDC.put("orderId", order.getId());
   orderService.process(order); // What if this throws?
   MDC.remove("orderId"); // Never reached on exception!
}

// ✅ GOOD: Always clean up with try-finally
public void processOrder(Order order) {
   MDC.put("orderId", order.getId());
   try {
       orderService.process(order);
   } finally {
       MDC.remove("orderId");
   }
}

// ✅ BETTER: Use MDC.putCloseable (SLF4J 1.7+)
public void processOrder(Order order) {
   try (MDC.MDCCloseable ignored = MDC.putCloseable("orderId", order.getId())) {
       orderService.process(order);
   }
}
In a servlet container with thread pooling, a leaked MDC value from Request A will appear in logs for Request B — leading to incredibly confusing debugging sessions.
# mdc with thread pools — the propagation problem
This is where most teams get bitten:
// ❌ MDC context is LOST when task runs on executor thread
ExecutorService executor = Executors.newFixedThreadPool(10);

MDC.put("requestId", "abc-123");
executor.submit(() -> {
   // MDC.get("requestId") returns null here!
   log.info("Processing async task"); // No requestId in logs
});
The fix — wrap your tasks to propagate MDC:
public class MdcAwareRunnable implements Runnable {
   private final Runnable delegate;
   private final Map<String, String> contextMap;

   public MdcAwareRunnable(Runnable delegate) {
       this.delegate = delegate;
       this.contextMap = MDC.getCopyOfContextMap(); // Capture at submission time
   }

   @Override
   public void run() {
       Map<String, String> previousContext = MDC.getCopyOfContextMap();
       try {
           if (contextMap != null) {
               MDC.setContextMap(contextMap);
           }
           delegate.run();
       } finally {
           if (previousContext != null) {
               MDC.setContextMap(previousContext);
           } else {
               MDC.clear();
           }
       }
   }
}

// Usage
executor.submit(new MdcAwareRunnable(() -> {
   log.info("Processing async task"); // requestId is now available!
}));
Or better yet, create an MDC-aware executor:
public class MdcAwareExecutorService implements ExecutorService {
   private final ExecutorService delegate;

   public MdcAwareExecutorService(ExecutorService delegate) {
       this.delegate = delegate;
   }

   @Override
   public <T> Future<T> submit(Callable<T> task) {
       Map<String, String> contextMap = MDC.getCopyOfContextMap();
       return delegate.submit(() -> {
           Map<String, String> previous = MDC.getCopyOfContextMap();
           try {
               if (contextMap != null) MDC.setContextMap(contextMap);
               return task.call();
           } finally {
               if (previous != null) MDC.setContextMap(previous);
               else MDC.clear();
           }
       });
   }

   @Override
   public Future<?> submit(Runnable task) {
       return submit(Executors.callable(task, null));
   }

   // ... delegate other methods similarly
}
# spring's taskDecorator — the elegant solution
Spring provides a cleaner way to handle MDC propagation in @Async methods:
@Configuration
@EnableAsync
public class AsyncConfig implements AsyncConfigurer {

   @Override
   public Executor getAsyncExecutor() {
       ThreadPoolTaskExecutor executor = new ThreadPoolTaskExecutor();
       executor.setCorePoolSize(10);
       executor.setMaxPoolSize(50);
       executor.setQueueCapacity(100);
       executor.setThreadNamePrefix("async-");
       executor.setTaskDecorator(new MdcTaskDecorator()); // Key line!
       executor.initialize();
       return executor;
   }
}

public class MdcTaskDecorator implements TaskDecorator {
   @Override
   public Runnable decorate(Runnable runnable) {
       Map<String, String> contextMap = MDC.getCopyOfContextMap();
       return () -> {
           try {
               if (contextMap != null) {
                   MDC.setContextMap(contextMap);
               }
               runnable.run();
           } finally {
               MDC.clear();
           }
       };
   }
}
Now every @Async method automatically gets the MDC context from the calling thread.
# building a correlation id system from scratch
Before we jump into full distributed tracing frameworks, let's build a simple but effective correlation ID system. This is valuable because:
- It teaches you the fundamentals
- Sometimes you don't need the full weight of a tracing framework
- It's a great foundation to build upon
# the filter — entry point for every request
@Component
@Order(Ordered.HIGHEST_PRECEDENCE)
public class CorrelationIdFilter extends OncePerRequestFilter {

   private static final String CORRELATION_ID_HEADER = "X-Correlation-ID";
   private static final String REQUEST_ID_KEY = "requestId";
   private static final String CLIENT_IP_KEY = "clientIp";
   private static final String REQUEST_URI_KEY = "requestUri";
   private static final String REQUEST_METHOD_KEY = "requestMethod";

   @Override
   protected void doFilterInternal(HttpServletRequest request,
                                    HttpServletResponse response,
                                    FilterChain filterChain) throws ServletException, IOException {

       try {
           // Extract or generate correlation ID
           String correlationId = extractOrGenerateCorrelationId(request);

           // Populate MDC
           MDC.put(REQUEST_ID_KEY, correlationId);
           MDC.put(CLIENT_IP_KEY, getClientIp(request));
           MDC.put(REQUEST_URI_KEY, request.getRequestURI());
           MDC.put(REQUEST_METHOD_KEY, request.getMethod());

           // Add correlation ID to response header (for client-side correlation)
           response.addHeader(CORRELATION_ID_HEADER, correlationId);

           // Continue the filter chain
           filterChain.doFilter(request, response);

       } finally {
           // CRITICAL: Always clean up MDC
           MDC.clear();
       }
   }

   private String extractOrGenerateCorrelationId(HttpServletRequest request) {
       String correlationId = request.getHeader(CORRELATION_ID_HEADER);
       if (correlationId == null || correlationId.isBlank()) {
           correlationId = generateCorrelationId();
       }
       return correlationId;
   }

   private String generateCorrelationId() {
       // Use a compact, URL-safe format
       // Prefix with timestamp for rough chronological ordering
       return String.format("%s-%s",
               Long.toHexString(System.currentTimeMillis()),
               UUID.randomUUID().toString().substring(0, 8));
   }

   private String getClientIp(HttpServletRequest request) {
       String xForwardedFor = request.getHeader("X-Forwarded-For");
       if (xForwardedFor != null && !xForwardedFor.isBlank()) {
           return xForwardedFor.split(",")[0].trim();
       }
       return request.getRemoteAddr();
   }
}
# propagating correlation id to downstream services
When Service A calls Service B, the correlation ID must travel with the request:
@Component
public class CorrelationIdRestTemplateInterceptor implements ClientHttpRequestInterceptor {

   private static final String CORRELATION_ID_HEADER = "X-Correlation-ID";

   @Override
   public ClientHttpResponse intercept(HttpRequest request, byte[] body,
                                        ClientHttpRequestExecution execution) throws IOException {
       String correlationId = MDC.get("requestId");
       if (correlationId != null) {
           request.getHeaders().add(CORRELATION_ID_HEADER, correlationId);
       }
       return execution.execute(request, body);
   }
}

@Configuration
public class RestTemplateConfig {

   @Bean
   public RestTemplate restTemplate(CorrelationIdRestTemplateInterceptor interceptor) {
       RestTemplate restTemplate = new RestTemplate();
       restTemplate.setInterceptors(List.of(interceptor));
       return restTemplate;
   }
}
For WebClient:
@Configuration
public class WebClientConfig {

   @Bean
   public WebClient webClient() {
       return WebClient.builder()
               .filter((request, next) -> {
                   String correlationId = MDC.get("requestId");
                   if (correlationId != null) {
                       return next.exchange(
                           ClientRequest.from(request)
                               .header("X-Correlation-ID", correlationId)
                               .build()
                       );
                   }
                   return next.exchange(request);
               })
               .build();
   }
}
# propagating through message queues
For Kafka:
// Producer side — inject correlation ID into message headers
@Component
public class CorrelationIdKafkaProducerInterceptor implements ProducerInterceptor<String, String> {

   @Override
   public ProducerRecord<String, String> onSend(ProducerRecord<String, String> record) {
       String correlationId = MDC.get("requestId");
       if (correlationId != null) {
           record.headers().add("X-Correlation-ID", correlationId.getBytes(StandardCharsets.UTF_8));
       }
       return record;
   }

   // ... other methods
}

// Consumer side — extract correlation ID from message headers
@KafkaListener(topics = "orders")
public void handleOrder(ConsumerRecord<String, String> record) {
   Header correlationHeader = record.headers().lastHeader("X-Correlation-ID");
   String correlationId = correlationHeader != null
           ? new String(correlationHeader.value(), StandardCharsets.UTF_8)
           : UUID.randomUUID().toString();

   MDC.put("requestId", correlationId);
   try {
       // Process the message
       processOrder(record.value());
   } finally {
       MDC.clear();
   }
}
# the result
With this setup, your logs now look like:
# Service A (API Gateway)
2024-03-15 10:30:01.123 [http-nio-8080-exec-1] [18f3a2b1-c4d5e6f7] INFO  OrderController - Received order request
2024-03-15 10:30:01.125 [http-nio-8080-exec-1] [18f3a2b1-c4d5e6f7] INFO  OrderController - Calling payment service

# Service B (Payment Service)
2024-03-15 10:30:01.130 [http-nio-8081-exec-3] [18f3a2b1-c4d5e6f7] INFO  PaymentController - Processing payment
2024-03-15 10:30:01.250 [http-nio-8081-exec-3] [18f3a2b1-c4d5e6f7] INFO  PaymentService - Payment successful

# Service C (Inventory Service, triggered via Kafka)
2024-03-15 10:30:01.300 [kafka-consumer-1] [18f3a2b1-c4d5e6f7] INFO  InventoryListener - Reserving stock
2024-03-15 10:30:01.450 [kafka-consumer-1] [18f3a2b1-c4d5e6f7] INFO  InventoryService - Stock reserved
Now you can grep for 18f3a2b1-c4d5e6f7 across all services and see the complete request flow. This is already a massive improvement.
But we can do better.
# spring boot integration patterns
# handlerInterceptor vs filter — when to use hich
Both can set up MDC, but they serve different purposes:
| Aspect | Filter (Servlet) | HandlerInterceptor (Spring MVC) |
|---|---|---|
| Scope | All requests (including static resources) | Only requests handled by DispatcherServlet |
| Access to | HttpServletRequest/Response | HandlerMethod, ModelAndView |
| MDC cleanup | In finally block | In afterCompletion() |
| Order control | @Order or FilterRegistrationBean | InterceptorRegistry.addInterceptor().order() |
| Recommendation | Use for correlation ID (runs first) | Use for business context (user ID, tenant ID) |
# adding business context with handlerInterceptor
@Component
public class BusinessContextInterceptor implements HandlerInterceptor {

   private final JwtTokenProvider tokenProvider;

   public BusinessContextInterceptor(JwtTokenProvider tokenProvider) {
       this.tokenProvider = tokenProvider;
   }

   @Override
   public boolean preHandle(HttpServletRequest request, HttpServletResponse response,
                             Object handler) {
       // Extract user context from JWT
       String authHeader = request.getHeader("Authorization");
       if (authHeader != null && authHeader.startsWith("Bearer ")) {
           try {
               String token = authHeader.substring(7);
               Claims claims = tokenProvider.parseToken(token);

               MDC.put("userId", claims.getSubject());
               MDC.put("tenantId", claims.get("tenantId", String.class));
               MDC.put("userRole", claims.get("role", String.class));
           } catch (Exception e) {
               // Don't fail the request just because we can't extract context
               // The security filter will handle authentication
           }
       }
       return true;
   }

   @Override
   public void afterCompletion(HttpServletRequest request, HttpServletResponse response,
                                Object handler, Exception ex) {
       MDC.remove("userId");
       MDC.remove("tenantId");
       MDC.remove("userRole");
   }
}

@Configuration
public class WebMvcConfig implements WebMvcConfigurer {

   @Autowired
   private BusinessContextInterceptor businessContextInterceptor;

   @Override
   public void addInterceptors(InterceptorRegistry registry) {
       registry.addInterceptor(businessContextInterceptor)
               .addPathPatterns("/api/**")
               .order(1);
   }
}
Now your logs include business context:
2024-03-15 10:30:01.123 [http-nio-8080-exec-1] [18f3a2b1-c4d5e6f7] [user-456] [tenant-acme] INFO OrderController - Received order request
# AOP-Based mdc for method-level context
Sometimes you want to add context at the method level:
@Target(ElementType.METHOD)
@Retention(RetentionPolicy.RUNTIME)
public @interface LogContext {
   String key();
   String valueExpression(); // SpEL expression
}

@Aspect
@Component
public class LogContextAspect {

   private final SpelExpressionParser parser = new SpelExpressionParser();

   @Around("@annotation(logContext)")
   public Object addLogContext(ProceedingJoinPoint joinPoint, LogContext logContext) throws Throwable {
       String value = evaluateExpression(logContext.valueExpression(), joinPoint);

       MDC.put(logContext.key(), value);
       try {
           return joinPoint.proceed();
       } finally {
           MDC.remove(logContext.key());
       }
   }

   private String evaluateExpression(String expression, ProceedingJoinPoint joinPoint) {
       StandardEvaluationContext context = new StandardEvaluationContext();
       Object[] args = joinPoint.getArgs();
       MethodSignature signature = (MethodSignature) joinPoint.getSignature();
       String[] paramNames = signature.getParameterNames();

       for (int i = 0; i < paramNames.length; i++) {
           context.setVariable(paramNames[i], args[i]);
       }

       return parser.parseExpression(expression).getValue(context, String.class);
   }
}

// Usage
@LogContext(key = "orderId", valueExpression = "#order.id")
public OrderResult processOrder(Order order) {
   log.info("Processing order"); // orderId automatically in MDC
   // ...
}
# distributed tracing with micrometer tracing
# the evolution: sleuth → micrometer tracing
If you've been in the Spring ecosystem for a while, you know Spring Cloud Sleuth. As of Spring Boot 3.x, Sleuth has been superseded by Micrometer Tracing. The concepts are the same, but the implementation is now part of the Micrometer observability stack.
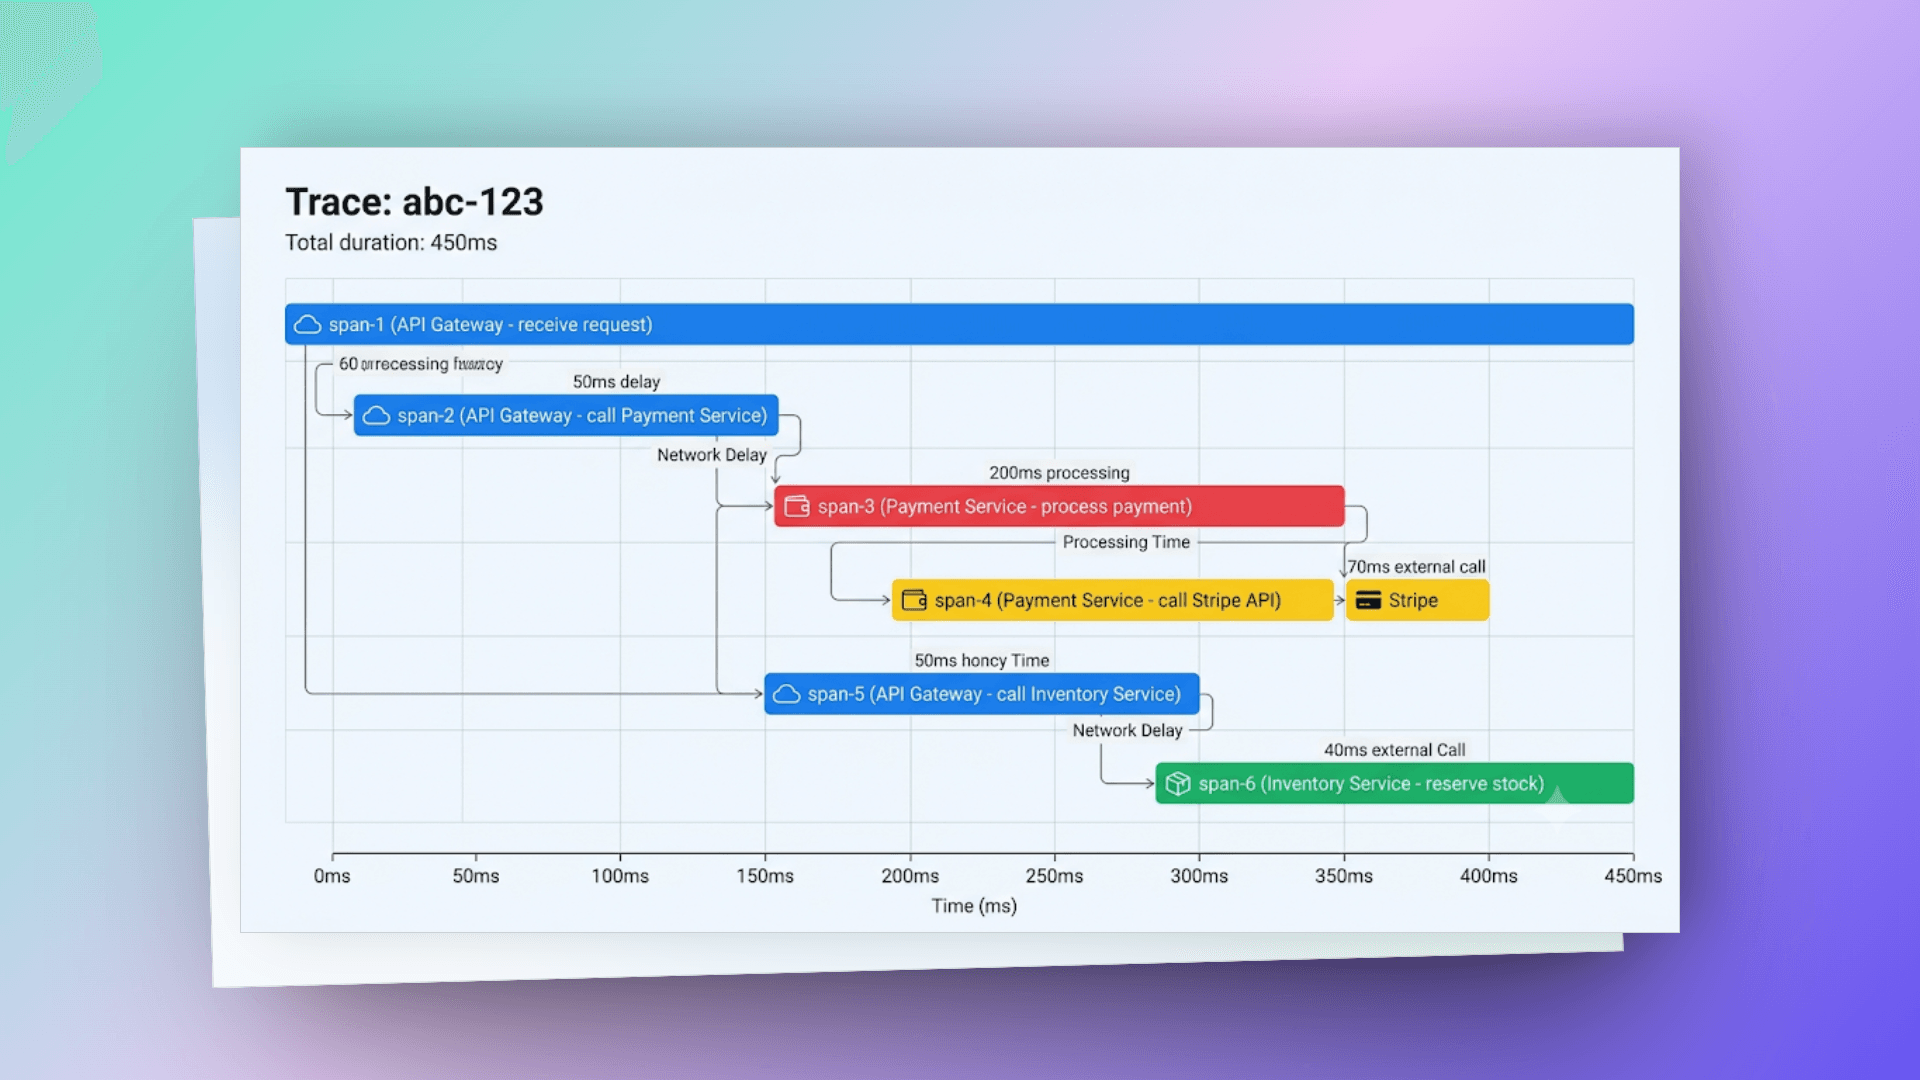
# key concepts
Before diving into code, let's align on terminology:
- Trace: The entire journey of a request across all services. Identified by a
traceId. - Span: A single unit of work within a trace. Identified by a
spanId. A trace is a tree of spans. - Parent Span: The span that initiated the current span. This creates the causal hierarchy.
- Baggage: Key-value pairs that propagate across service boundaries (like MDC, but distributed).
- Sampling: The decision of whether to record and export a trace (not every trace needs to be stored).
# setting up micrometer tracing with zipkin
# dependencies (maven)
<dependencies>
   <!-- Spring Boot Actuator (required for observability) -->
   <dependency>
       <groupId>org.springframework.boot</groupId>
       <artifactId>spring-boot-starter-actuator</artifactId>
   </dependency>

   <!-- Micrometer Tracing Bridge (choose ONE) -->
   <!-- Option A: Brave (Zipkin's tracing library) -->
   <dependency>
       <groupId>io.micrometer</groupId>
       <artifactId>micrometer-tracing-bridge-brave</artifactId>
   </dependency>

   <!-- Option B: OpenTelemetry -->
   <!--
   <dependency>
       <groupId>io.micrometer</groupId>
       <artifactId>micrometer-tracing-bridge-otel</artifactId>
   </dependency>
   -->

   <!-- Reporter: Send traces to Zipkin -->
   <dependency>
       <groupId>io.zipkin.reporter2</groupId>
       <artifactId>zipkin-reporter-brave</artifactId>
   </dependency>

   <!-- For WebClient integration -->
   <dependency>
       <groupId>org.springframework.boot</groupId>
       <artifactId>spring-boot-starter-webflux</artifactId>
   </dependency>
</dependencies>
# configuration
# application.yml
spring:
  application:
    name: order-service

management:
  tracing:
    sampling:
      probability: 1.0 # 100% sampling for dev; use 0.1 (10%) for production
  zipkin:
    tracing:
      endpoint: http://localhost:9411/api/v2/spans

logging:
  pattern:
    level: '%5p [${spring.application.name:},%X{traceId:-},%X{spanId:-}]'
That's it. With these dependencies and config, Spring Boot auto-configures:
- Trace and span ID generation
- MDC population with
traceIdandspanId - Propagation headers (
traceparentfor W3C,X-B3-TraceIdfor B3/Zipkin) - Auto-instrumentation for RestTemplate, WebClient, and Spring MVC
- Trace export to Zipkin
# how it works behind the scenes
When a request arrives:
1. Request hits Spring MVC DispatcherServlet
2. Micrometer's ServerHttpObservationFilter creates a new Span
3. If incoming headers contain trace context (traceparent/X-B3-*):
  → Extract traceId and create a child span
4. If no trace context:
  → Generate new traceId and root span
5. traceId and spanId are automatically put into MDC
6. Your log pattern picks them up via %X{traceId} and %X{spanId}
7. When you call another service via RestTemplate/WebClient:
  → Micrometer injects trace context into outgoing headers
8. When the span completes:
  → Span data is sent to Zipkin (async, non-blocking)
# custom spans for business operations
Auto-instrumentation covers HTTP calls, but you often want spans for business logic:
@Service
public class OrderService {

   private static final Logger log = LoggerFactory.getLogger(OrderService.class);
   private final ObservationRegistry observationRegistry;

   public OrderService(ObservationRegistry observationRegistry) {
       this.observationRegistry = observationRegistry;
   }

   public OrderResult createOrder(CreateOrderRequest request) {
       return Observation.createNotStarted("order.create", observationRegistry)
               .lowCardinalityKeyValue("order.type", request.getType().name())
               .highCardinalityKeyValue("order.itemCount", String.valueOf(request.getItems().size()))
               .observe(() -> {
                   log.info("Creating order with {} items", request.getItems().size());

                   // Validate
                   validateOrder(request);

                   // Process payment
                   PaymentResult payment = processPayment(request);

                   // Reserve inventory
                   reserveInventory(request);

                   log.info("Order created successfully");
                   return new OrderResult(payment.getTransactionId());
               });
   }

   private void validateOrder(CreateOrderRequest request) {
       Observation.createNotStarted("order.validate", observationRegistry)
               .observe(() -> {
                   log.info("Validating order");
                   // validation logic
               });
   }
}
Or use the @Observed annotation for cleaner code:
@Configuration
public class ObservationConfig {
   @Bean
   public ObservedAspect observedAspect(ObservationRegistry registry) {
       return new ObservedAspect(registry);
   }
}

@Service
public class PaymentService {

   @Observed(name = "payment.process",
             contextualName = "process-payment",
             lowCardinalityKeyValues = {"payment.method", "credit_card"})
   public PaymentResult processPayment(PaymentRequest request) {
       // This entire method is now a span
       log.info("Processing payment of {}", request.getAmount());
       // ...
   }
}
# baggage — propagating business context across services
Baggage is like MDC, but it crosses service boundaries:
@Component
public class BaggageFilter extends OncePerRequestFilter {

   private final Tracer tracer;

   public BaggageFilter(Tracer tracer) {
       this.tracer = tracer;
   }

   @Override
   protected void doFilterInternal(HttpServletRequest request,
                                    HttpServletResponse response,
                                    FilterChain filterChain) throws ServletException, IOException {

       // Set baggage that will propagate to all downstream services
       try (BaggageInScope userId = tracer.createBaggageInScope("userId",
               extractUserId(request))) {
           try (BaggageInScope tenantId = tracer.createBaggageInScope("tenantId",
                   extractTenantId(request))) {
               filterChain.doFilter(request, response);
           }
       }
   }
}
Configure which baggage fields to propagate:
management:
  tracing:
    baggage:
      remote-fields:
        - userId
        - tenantId
        - requestSource
      correlation:
        fields:
          - userId
          - tenantId
The correlation.fields config automatically copies baggage values into MDC — so they appear in your logs without any extra code.
# the reactive challenge — mdc in webFlux
# the problem
If you're using Spring WebFlux (reactive stack), MDC is fundamentally broken out of the box. Here's why:
In reactive programming, a single request might execute across multiple threads. The Reactor scheduler can switch threads at any operator boundary. Since MDC is thread-local, your trace context disappears:
// In WebFlux, this LOSES MDC context
webClient.get().uri("/api/users")
   .retrieve()
   .bodyToMono(User.class)
   .map(user -> {
       log.info("Got user: {}", user.getName()); // MDC is empty here!
       return user;
   });
# solution 1: reactor context + hook (recommended for Spring Boot 3.x)
Spring Boot 3.x with Micrometer Tracing handles this automatically via Reactor's Context Propagation library:
<dependency>
   <groupId>io.micrometer</groupId>
   <artifactId>context-propagation</artifactId>
</dependency>
// In your main application class or configuration
@PostConstruct
public void setupReactorContext() {
// This enables automatic context propagation in Reactor
Hooks.enableAutomaticContextPropagation();
}With this setup, Micrometer Tracing automatically:
- Stores trace context in Reactor's
Context - Restores it to MDC when operators execute
- Propagates it through the entire reactive chain
# solution 2: manual context propagation (for custom mdc values)
If you need to propagate custom MDC values beyond what Micrometer handles:
public class MdcContextLifter<T> implements CoreSubscriber<T> {

   private final CoreSubscriber<T> delegate;
   private final Map<String, String> mdcContext;

   public MdcContextLifter(CoreSubscriber<T> delegate) {
       this.delegate = delegate;
       this.mdcContext = delegate.currentContext()
               .getOrDefault("mdc", Collections.emptyMap());
   }

   @Override
   public void onSubscribe(Subscription s) {
       copyToMdc(mdcContext);
       delegate.onSubscribe(s);
   }

   @Override
   public void onNext(T t) {
       copyToMdc(mdcContext);
       delegate.onNext(t);
   }

   @Override
   public void onError(Throwable t) {
       copyToMdc(mdcContext);
       delegate.onError(t);
   }

   @Override
   public void onComplete() {
       copyToMdc(mdcContext);
       delegate.onComplete();
   }

   @Override
   public Context currentContext() {
       return delegate.currentContext();
   }

   private void copyToMdc(Map<String, String> context) {
       if (context != null && !context.isEmpty()) {
           MDC.setContextMap(context);
       } else {
           MDC.clear();
       }
   }
}
Register it as a Reactor Hook:
@Configuration
public class ReactorMdcConfig {

   @PostConstruct
   public void setupMdcHook() {
       Hooks.onEachOperator("mdc",
           Operators.lift((scannable, subscriber) -> new MdcContextLifter<>(subscriber)));
   }

   @PreDestroy
   public void cleanupMdcHook() {
       Hooks.resetOnEachOperator("mdc");
   }
}
Usage in WebFlux:
@RestController
public class OrderController {

   @GetMapping("/orders/{id}")
   public Mono<Order> getOrder(@PathVariable String id) {
       return orderService.findById(id)
               .contextWrite(ctx -> ctx.put("mdc",
                   Map.of("orderId", id, "operation", "getOrder")));
   }
}
# solution 3: kotlin coroutines + mdc
If you're using Kotlin coroutines with Spring WebFlux:
import kotlinx.coroutines.slf4j.MDCContext
import kotlinx.coroutines.withContext

@RestController
class OrderController(private val orderService: OrderService) {

   @GetMapping("/orders/{id}")
   suspend fun getOrder(@PathVariable id: String): Order {
       return withContext(MDCContext()) {
           MDC.put("orderId", id)
           orderService.findById(id)
       }
   }
}
The MDCContext() coroutine context element automatically propagates MDC across coroutine suspensions.
# advanced patterns for production
# pattern 1: structured logging with logstash encoder
Plain text logs are fine for local development, but in production you want structured (JSON) logs that can be parsed by ELK, Datadog, Splunk, etc.:
<dependency>
   <groupId>net.logstash.logback</groupId>
   <artifactId>logstash-logback-encoder</artifactId>
   <version>7.4</version>
</dependency>
<!-- logback-spring.xml -->
<springProfile name="production">
<appender name="CONSOLE" class="ch.qos.logback.core.ConsoleAppender">
<encoder class="net.logstash.logback.encoder.LogstashEncoder">
<includeMdcKeyName>traceId</includeMdcKeyName>
<includeMdcKeyName>spanId</includeMdcKeyName>
<includeMdcKeyName>requestId</includeMdcKeyName>
<includeMdcKeyName>userId</includeMdcKeyName>
<includeMdcKeyName>tenantId</includeMdcKeyName>
<customFields>
{"service":"${APP_NAME}","env":"${APP_ENV}"}
</customFields>
<!-- Add request/response timing -->
<provider class="net.logstash.logback.composite.loggingevent.ArgumentsJsonProvider"/>
</encoder>
</appender>
</springProfile>Output:
{
  "@timestamp": "2024-03-15T10:30:01.123Z",
  "level": "INFO",
  "thread": "http-nio-8080-exec-1",
  "logger": "com.myapp.OrderController",
  "message": "Order created successfully",
  "traceId": "64f8a2b1c4d5e6f7a8b9c0d1e2f3a4b5",
  "spanId": "a8b9c0d1e2f3a4b5",
  "requestId": "18f3a2b1-c4d5e6f7",
  "userId": "user-456",
  "tenantId": "tenant-acme",
  "service": "order-service",
  "env": "production"
}
# pattern 2: dynamic log level with mdc
Change log levels for specific users or requests without redeploying:
// Custom Logback TurboFilter
public class MdcBasedTurboFilter extends TurboFilter {

   private final Set<String> debugUsers = ConcurrentHashMap.newKeySet();
   private final Set<String> debugTraces = ConcurrentHashMap.newKeySet();

   @Override
   public FilterReply decide(Marker marker, Logger logger, Level level,
                              String format, Object[] params, Throwable t) {

       String userId = MDC.get("userId");
       String traceId = MDC.get("traceId");

       // Enable DEBUG for specific users
       if (userId != null && debugUsers.contains(userId)) {
           return level.isGreaterOrEqual(Level.DEBUG)
                   ? FilterReply.ACCEPT : FilterReply.NEUTRAL;
       }

       // Enable DEBUG for specific traces
       if (traceId != null && debugTraces.contains(traceId)) {
           return level.isGreaterOrEqual(Level.DEBUG)
                   ? FilterReply.ACCEPT : FilterReply.NEUTRAL;
       }

       return FilterReply.NEUTRAL;
   }

   public void enableDebugForUser(String userId) {
       debugUsers.add(userId);
   }

   public void disableDebugForUser(String userId) {
       debugUsers.remove(userId);
   }
}
Expose it via an actuator endpoint:
@RestController
@RequestMapping("/admin/logging")
public class DynamicLoggingController {

   private final MdcBasedTurboFilter turboFilter;

   @PostMapping("/debug/user/{userId}")
   public ResponseEntity<String> enableDebugForUser(@PathVariable String userId) {
       turboFilter.enableDebugForUser(userId);
       return ResponseEntity.ok("Debug enabled for user: " + userId);
   }

   @DeleteMapping("/debug/user/{userId}")
   public ResponseEntity<String> disableDebugForUser(@PathVariable String userId) {
       turboFilter.disableDebugForUser(userId);
       return ResponseEntity.ok("Debug disabled for user: " + userId);
   }
}
# pattern 3: request/response logging with mdc
@Component
@Order(Ordered.HIGHEST_PRECEDENCE + 1)
public class RequestResponseLoggingFilter extends OncePerRequestFilter {

   private static final Logger log = LoggerFactory.getLogger(RequestResponseLoggingFilter.class);

   @Override
   protected void doFilterInternal(HttpServletRequest request,
                                    HttpServletResponse response,
                                    FilterChain filterChain) throws ServletException, IOException {

       long startTime = System.currentTimeMillis();

       // Wrap response to capture status
       ContentCachingResponseWrapper responseWrapper =
               new ContentCachingResponseWrapper(response);

       try {
           MDC.put("httpMethod", request.getMethod());
           MDC.put("httpUri", request.getRequestURI());

           log.info("Incoming request: {} {}", request.getMethod(), request.getRequestURI());

           filterChain.doFilter(request, responseWrapper);

       } finally {
           long duration = System.currentTimeMillis() - startTime;

           MDC.put("httpStatus", String.valueOf(responseWrapper.getStatus()));
           MDC.put("responseTimeMs", String.valueOf(duration));

           log.info("Completed request: {} {} → {} ({}ms)",
                   request.getMethod(),
                   request.getRequestURI(),
                   responseWrapper.getStatus(),
                   duration);

           MDC.remove("httpMethod");
           MDC.remove("httpUri");
           MDC.remove("httpStatus");
           MDC.remove("responseTimeMs");

           responseWrapper.copyBodyToResponse();
       }
   }

   @Override
   protected boolean shouldNotFilter(HttpServletRequest request) {
       String path = request.getRequestURI();
       // Skip health checks and actuator endpoints
       return path.startsWith("/actuator") || path.equals("/health");
   }
}
# pattern 4: error tracking with mdc
Enrich error logs with full context for faster debugging:
@ControllerAdvice
public class GlobalExceptionHandler {

   private static final Logger log = LoggerFactory.getLogger(GlobalExceptionHandler.class);

   @ExceptionHandler(Exception.class)
   public ResponseEntity<ErrorResponse> handleException(Exception ex, HttpServletRequest request) {
       String errorId = UUID.randomUUID().toString().substring(0, 8);

       MDC.put("errorId", errorId);
       MDC.put("errorType", ex.getClass().getSimpleName());

       log.error("Unhandled exception [errorId={}]: {}", errorId, ex.getMessage(), ex);

       MDC.remove("errorId");
       MDC.remove("errorType");

       ErrorResponse errorResponse = new ErrorResponse(
               errorId,
               "An internal error occurred. Reference: " + errorId,
               request.getRequestURI()
       );

       return ResponseEntity.status(HttpStatus.INTERNAL_SERVER_ERROR).body(errorResponse);
   }
}
The user gets an error ID they can share with support, and you can instantly find the full stack trace with all MDC context.
# performance considerations
# mdc overhead
MDC operations are fast but not free:
| Operation | Approximate Cost |
|---|---|
MDC.put() | ~50-100ns |
MDC.get() | ~30-50ns |
MDC.getCopyOfContextMap() | ~200-500ns (depends on map size) |
MDC.clear() | ~50ns |
For most applications, this is negligible. But if you're processing millions of events per second, be mindful of:
Map copy frequency:
getCopyOfContextMap()creates a new HashMap each time. In high-throughput async scenarios, this can generate significant garbage.AsyncAppender tuning: The default queue size (256) might be too small for high-throughput services:
<appender name="ASYNC" class="ch.qos.logback.classic.AsyncAppender">
   <queueSize>1024</queueSize>
   <discardingThreshold>20</discardingThreshold> <!-- Start discarding at 20% capacity -->
   <includeCallerData>false</includeCallerData> <!-- Expensive! Only enable for debugging -->
   <neverBlock>true</neverBlock> <!-- Don't block application threads -->
   <appender-ref ref="FILE"/>
</appender>- Sampling in production: Don't export 100% of traces in production:
management:
  tracing:
    sampling:
      probability: 0.1 # Sample 10% of traces
For critical paths, you can force sampling:
@Observed(name = "payment.process")
public PaymentResult processPayment(PaymentRequest request) {
   // Force this span to be sampled regardless of probability
   Span currentSpan = tracer.currentSpan();
   if (currentSpan != null) {
       currentSpan.tag("sampling.priority", "1");
   }
   // ...
}
# logback performance tips
- Use parameterized logging — always:
// ❌ String concatenation happens even if DEBUG is disabled
log.debug("Processing order " + orderId + " for user " + userId);

// ✅ Parameters only evaluated if DEBUG is enabled
log.debug("Processing order {} for user {}", orderId, userId);- Guard expensive log computations:
// ❌ toJson() is called even if TRACE is disabled
log.trace("Full request body: {}", request.toJson());

// ✅ Only compute if TRACE is enabled
if (log.isTraceEnabled()) {
   log.trace("Full request body: {}", request.toJson());
}- Use markers for filterable logging:
private static final Marker SECURITY = MarkerFactory.getMarker("SECURITY");
private static final Marker PERFORMANCE = MarkerFactory.getMarker("PERFORMANCE");

log.info(SECURITY, "Failed login attempt for user {}", username);
log.warn(PERFORMANCE, "Slow query detected: {}ms", queryTime);
<!-- Route SECURITY markers to a separate appender -->
<appender name="SECURITY_FILE" class="ch.qos.logback.core.rolling.RollingFileAppender">
<filter class="ch.qos.logback.core.filter.EvaluatorFilter">
<evaluator class="ch.qos.logback.classic.boolex.OnMarkerEvaluator">
<marker>SECURITY</marker>
</evaluator>
<onMatch>ACCEPT</onMatch>
<onMismatch>DENY</onMismatch>
</filter>
<!-- ... -->
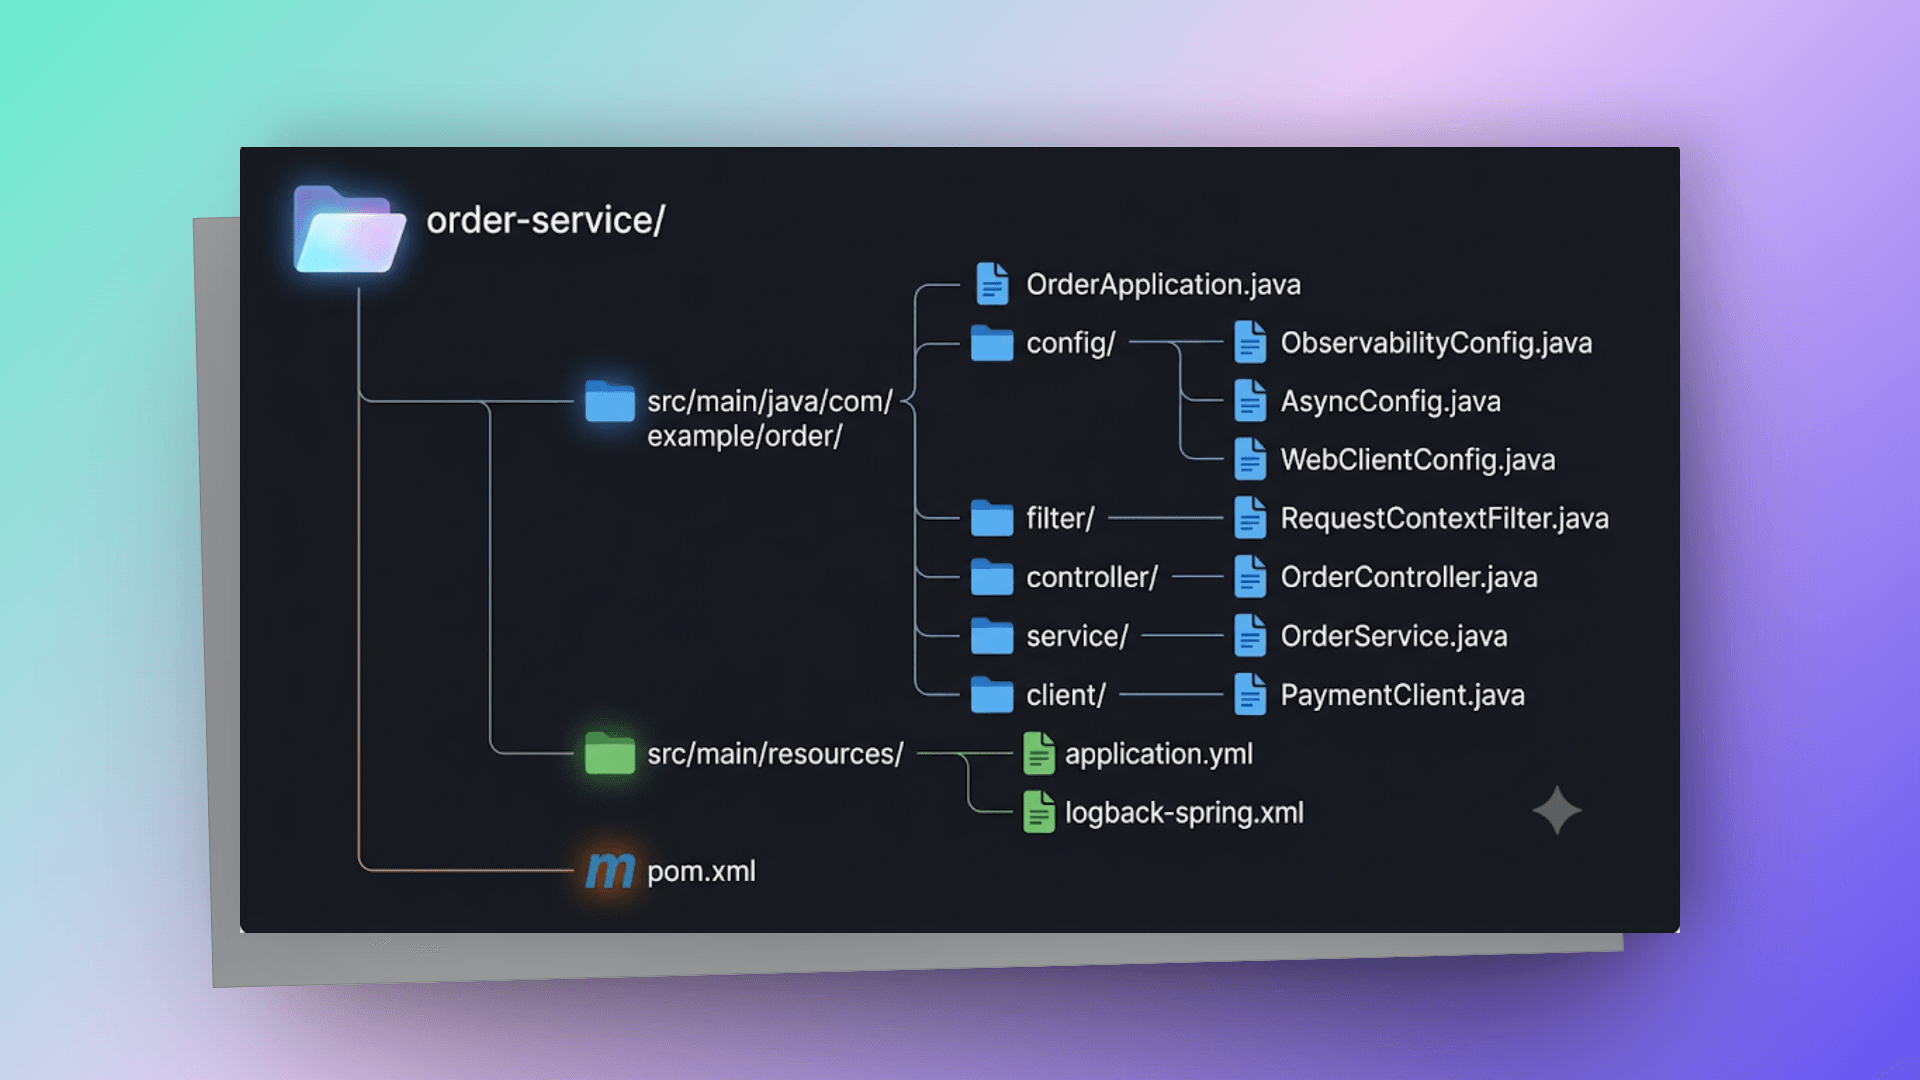
</appender># putting it all together — a complete example
Let's build a minimal but complete example that ties everything together. Imagine an order processing system with two services.
# project structure
# ObservabilityConfig.java
@Configuration
public class ObservabilityConfig {

   @Bean
   public ObservedAspect observedAspect(ObservationRegistry registry) {
       return new ObservedAspect(registry);
   }
}
# AsyncConfig.java
@Configuration
@EnableAsync
public class AsyncConfig implements AsyncConfigurer {

   @Override
   public Executor getAsyncExecutor() {
       ThreadPoolTaskExecutor executor = new ThreadPoolTaskExecutor();
       executor.setCorePoolSize(5);
       executor.setMaxPoolSize(20);
       executor.setQueueCapacity(50);
       executor.setThreadNamePrefix("async-");
       executor.setTaskDecorator(runnable -> {
           Map<String, String> contextMap = MDC.getCopyOfContextMap();
           return () -> {
               try {
                   if (contextMap != null) MDC.setContextMap(contextMap);
                   runnable.run();
               } finally {
                   MDC.clear();
               }
           };
       });
       executor.initialize();
       return executor;
   }
}
# RequestContextFilter.java
@Component
@Order(Ordered.HIGHEST_PRECEDENCE)
public class RequestContextFilter extends OncePerRequestFilter {

   private static final Logger log = LoggerFactory.getLogger(RequestContextFilter.class);

   @Override
   protected void doFilterInternal(HttpServletRequest request,
                                    HttpServletResponse response,
                                    FilterChain filterChain) throws ServletException, IOException {
       long startTime = System.currentTimeMillis();

       try {
           MDC.put("clientIp", getClientIp(request));
           MDC.put("httpMethod", request.getMethod());
           MDC.put("httpUri", request.getRequestURI());

           log.info("→ {} {}", request.getMethod(), request.getRequestURI());
           filterChain.doFilter(request, response);

       } finally {
           long duration = System.currentTimeMillis() - startTime;
           log.info("← {} {} → {} ({}ms)",
                   request.getMethod(), request.getRequestURI(),
                   response.getStatus(), duration);
           MDC.clear();
       }
   }

   private String getClientIp(HttpServletRequest request) {
       String xff = request.getHeader("X-Forwarded-For");
       return (xff != null) ? xff.split(",")[0].trim() : request.getRemoteAddr();
   }

   @Override
   protected boolean shouldNotFilter(HttpServletRequest request) {
       return request.getRequestURI().startsWith("/actuator");
   }
}
# OrderController.java
@RestController
@RequestMapping("/api/orders")
public class OrderController {

   private static final Logger log = LoggerFactory.getLogger(OrderController.class);
   private final OrderService orderService;

   public OrderController(OrderService orderService) {
       this.orderService = orderService;
   }

   @PostMapping
   public ResponseEntity<OrderResponse> createOrder(@RequestBody CreateOrderRequest request) {
       log.info("Received order request with {} items", request.getItems().size());
       OrderResponse response = orderService.createOrder(request);
       log.info("Order {} created successfully", response.getOrderId());
       return ResponseEntity.status(HttpStatus.CREATED).body(response);
   }
}
# OrderService.java
@Service
public class OrderService {

   private static final Logger log = LoggerFactory.getLogger(OrderService.class);
   private final PaymentClient paymentClient;
   private final ObservationRegistry observationRegistry;

   public OrderService(PaymentClient paymentClient, ObservationRegistry observationRegistry) {
       this.paymentClient = paymentClient;
       this.observationRegistry = observationRegistry;
   }

   public OrderResponse createOrder(CreateOrderRequest request) {
       return Observation.createNotStarted("order.create", observationRegistry)
               .lowCardinalityKeyValue("order.type", request.getType())
               .observe(() -> {
                   String orderId = UUID.randomUUID().toString();
                   MDC.put("orderId", orderId);

                   try {
                       log.info("Validating order");
                       validateOrder(request);

                       log.info("Processing payment");
                       PaymentResponse payment = paymentClient.processPayment(
                               new PaymentRequest(orderId, request.getTotalAmount()));

                       log.info("Payment processed: txnId={}", payment.getTransactionId());

                       return new OrderResponse(orderId, "CONFIRMED", payment.getTransactionId());
                   } finally {
                       MDC.remove("orderId");
                   }
               });
   }

   private void validateOrder(CreateOrderRequest request) {
       Observation.createNotStarted("order.validate", observationRegistry)
               .observe(() -> {
                   if (request.getItems().isEmpty()) {
                       throw new IllegalArgumentException("Order must have at least one item");
                   }
                   log.info("Order validation passed");
               });
   }
}
# PaymentClient.java
@Component
public class PaymentClient {

   private static final Logger log = LoggerFactory.getLogger(PaymentClient.class);
   private final WebClient webClient;

   public PaymentClient(@Value("${services.payment.url}") String paymentUrl,
                         WebClient.Builder webClientBuilder) {
       this.webClient = webClientBuilder.baseUrl(paymentUrl).build();
   }

   public PaymentResponse processPayment(PaymentRequest request) {
       log.info("Calling payment service for order {}", request.getOrderId());

       return webClient.post()
               .uri("/api/payments")
               .bodyValue(request)
               .retrieve()
               .bodyToMono(PaymentResponse.class)
               .doOnSuccess(resp -> log.info("Payment service responded: {}", resp.getStatus()))
               .doOnError(err -> log.error("Payment service call failed: {}", err.getMessage()))
               .block();
   }
}
# application.yml
spring:
  application:
    name: order-service

server:
  port: 8080

services:
  payment:
    url: http://localhost:8081

management:
  tracing:
    sampling:
      probability: 1.0
  zipkin:
    tracing:
      endpoint: http://localhost:9411/api/v2/spans
  endpoints:
    web:
      exposure:
        include: health,info,metrics,prometheus

logging:
  level:
    com.example: DEBUG
    org.springframework.web: INFO
# logback-spring.xml
<?xml version="1.0" encoding="UTF-8"?>
<configuration>
   <springProperty scope="context" name="APP_NAME" source="spring.application.name"
                   defaultValue="app"/>

   <property name="CONSOLE_PATTERN"
             value="%d{HH:mm:ss.SSS} %highlight(%-5level) [%thread] [%X{traceId:-}|%X{spanId:-}] %cyan(%logger{24}) - %msg%n"/>

   <springProfile name="!production">
       <appender name="CONSOLE" class="ch.qos.logback.core.ConsoleAppender">
           <encoder>
               <pattern>${CONSOLE_PATTERN}</pattern>
           </encoder>
       </appender>
   </springProfile>

   <springProfile name="production">
       <appender name="CONSOLE" class="ch.qos.logback.core.ConsoleAppender">
           <encoder class="net.logstash.logback.encoder.LogstashEncoder">
               <customFields>{"service":"${APP_NAME}"}</customFields>
           </encoder>
       </appender>
   </springProfile>

   <root level="INFO">
       <appender-ref ref="CONSOLE"/>
   </root>

   <logger name="com.example" level="DEBUG"/>
</configuration>
# what the logs look like
Local development:
10:30:01.123 INFO  [http-nio-8080-exec-1] [64f8a2b1c4d5e6f7|a8b9c0d1e2f3a4b5] RequestContextFilter - → POST /api/orders
10:30:01.125 INFO  [http-nio-8080-exec-1] [64f8a2b1c4d5e6f7|a8b9c0d1e2f3a4b5] OrderController      - Received order request with 3 items
10:30:01.126 DEBUG [http-nio-8080-exec-1] [64f8a2b1c4d5e6f7|b1c2d3e4f5a6b7c8] OrderService         - Validating order
10:30:01.127 DEBUG [http-nio-8080-exec-1] [64f8a2b1c4d5e6f7|b1c2d3e4f5a6b7c8] OrderService         - Order validation passed
10:30:01.128 INFO  [http-nio-8080-exec-1] [64f8a2b1c4d5e6f7|c2d3e4f5a6b7c8d9] PaymentClient        - Calling payment service for order ord-123
10:30:01.250 INFO  [http-nio-8080-exec-1] [64f8a2b1c4d5e6f7|c2d3e4f5a6b7c8d9] PaymentClient        - Payment service responded: SUCCESS
10:30:01.251 INFO  [http-nio-8080-exec-1] [64f8a2b1c4d5e6f7|a8b9c0d1e2f3a4b5] OrderController      - Order ord-123 created successfully
10:30:01.252 INFO  [http-nio-8080-exec-1] [64f8a2b1c4d5e6f7|a8b9c0d1e2f3a4b5] RequestContextFilter - ← POST /api/orders → 201 (129ms)
Notice how:
traceId(64f8a2b1...) stays the same across the entire requestspanIdchanges for each operation (validation, payment call)- You can trace this exact request in Zipkin using the traceId
# lessons learned from production
After running distributed tracing in production across dozens of microservices, here are the hard-won lessons:
# lesson 1: start with correlation ids, not full tracing
Don't try to set up Zipkin/Jaeger on day one. Start with a simple correlation ID filter and MDC. You'll get 80% of the debugging value with 20% of the effort. Add full tracing when you actually need span-level visibility.
# lesson 2: MDC.clear() is non-negotiable
I've seen production incidents caused by MDC leaks. A request from User A had User B's tenant ID in the logs because the previous request on that thread didn't clean up. Always use try-finally. Always.
# lesson 3: structured logging from day one
Switching from text logs to JSON logs in a running system is painful. Start with structured logging (Logstash encoder) from the beginning. Your future self (and your SRE team) will thank you.
# lesson 4: don't log sensitive data in mdc
MDC values appear in every log line. If you put a user's email or auth token in MDC, it's now in every log line for that request. Use opaque identifiers (user IDs, not emails).
# lesson 5: sampling strategy matters
100% sampling in production will:
- Generate massive amounts of trace data
- Increase network traffic to your trace collector
- Cost you money in storage
Start with 10% sampling. Use force-sampling for error paths and critical business operations.
# lesson 6: baggage has overhead
Every baggage field is sent as an HTTP header to every downstream service. Keep baggage minimal — only propagate what downstream services actually need. Use MDC for local-only context.
# lesson 7: test your mdc propagation
Write integration tests that verify MDC propagation:
@SpringBootTest
class MdcPropagationTest {

   @Autowired
   private ThreadPoolTaskExecutor asyncExecutor;

   @Test
   void mdcShouldPropagateToAsyncThreads() throws Exception {
       MDC.put("testKey", "testValue");

       CompletableFuture<String> future = CompletableFuture.supplyAsync(() -> {
           return MDC.get("testKey");
       }, asyncExecutor);

       assertThat(future.get()).isEqualTo("testValue");

       MDC.clear();
   }
}
# lesson 8: monitor your tracing infrastructure
Your tracing system is itself a distributed system. Monitor it:
- Zipkin/Jaeger availability
- Trace export queue depth
- Dropped spans (due to sampling or queue overflow)
- Trace storage capacity
lesson 9: use trace ids in error responses
When returning errors to clients, include the trace ID:
@ExceptionHandler(Exception.class)
public ResponseEntity<ErrorResponse> handleError(Exception ex) {
   String traceId = tracer.currentSpan() != null
           ? tracer.currentSpan().context().traceId()
           : "unknown";

   return ResponseEntity.status(500).body(new ErrorResponse(
           "Internal Server Error",
           "Reference: " + traceId  // User can share this with support
   ));
}
This creates a direct link between user-reported issues and your trace data.
# lesson 10: invest in dashboards
Raw traces are useful for debugging individual requests. But for understanding system behavior, build dashboards:
- P50/P95/P99 latency per service and endpoint
- Error rate by service
- Trace completion rate (are traces being dropped?)
- Top-N slowest endpoints
- Cross-service dependency map
Tools like Grafana + Tempo, or Datadog APM, can generate these from your trace data.
# conclusion
Observability in microservices isn't optional — it's a survival skill. The combination of Logback, MDC, and distributed tracing gives you the tools to go from "something is broken somewhere" to "this specific request failed at this specific point because of this specific reason" in seconds instead of hours.
The key takeaways:
- MDC is your foundation — it's simple, powerful, and built into the logging framework you're already using
- Always clean up MDC —
try-finallyorMDC.putCloseable(), no exceptions - Handle async propagation explicitly — MDC is thread-local, so you need to propagate it across thread boundaries
- Start simple, evolve gradually — correlation IDs first, then full distributed tracing
- Structured logging is worth the investment — JSON logs + centralized logging = fast debugging
- Micrometer Tracing is the future — if you're on Spring Boot 3.x, embrace it
- Reactive requires special attention — use context propagation libraries, don't fight the framework
The goal isn't perfect observability — it's enough observability to debug production issues quickly and confidently. Start with the basics, measure what matters, and iterate.
Chỉ là những ghi chép cá nhân với hy vọng mang lại chút giá trị. Nếu thấy hữu ích, đừng ngại chia sẻ cho bạn bè & đồng nghiệp nhé!
Happy coding 😎 👍🏻 🚀 🔥.
On this page
- # introduction: the log that told te nothing
- # understanding the problem space
- # why traditional logging breaks in microservices
- # what we need
- # logback fundamentals — beyond the basics
- # why logback?
- # logback architecture in 60 seconds
- # a production-ready logback-spring.xml
- # mdc deep dive — the secret weapon
- # what is mdc?
- # the mdc api
- # How mdc works under the hood
- # mdc lifecycle management — the #1 mistake
- # mdc with thread pools — the propagation problem
- # spring's taskDecorator — the elegant solution
- # building a correlation id system from scratch
- # the filter — entry point for every request
- # propagating correlation id to downstream services
- # propagating through message queues
- # the result
- # spring boot integration patterns
- # handlerInterceptor vs filter — when to use hich
- # adding business context with handlerInterceptor
- # AOP-Based mdc for method-level context
- # distributed tracing with micrometer tracing
- # the evolution: sleuth → micrometer tracing
- # key concepts
- # setting up micrometer tracing with zipkin
- # dependencies (maven)
- # configuration
- # how it works behind the scenes
- # custom spans for business operations
- # baggage — propagating business context across services
- # the reactive challenge — mdc in webFlux
- # the problem
- # solution 1: reactor context + hook (recommended for Spring Boot 3.x)
- # solution 2: manual context propagation (for custom mdc values)
- # solution 3: kotlin coroutines + mdc
- # advanced patterns for production
- # pattern 1: structured logging with logstash encoder
- # pattern 2: dynamic log level with mdc
- # pattern 3: request/response logging with mdc
- # pattern 4: error tracking with mdc
- # performance considerations
- # mdc overhead
- # logback performance tips
- # putting it all together — a complete example
- # project structure
- # ObservabilityConfig.java
- # AsyncConfig.java
- # RequestContextFilter.java
- # OrderController.java
- # OrderService.java
- # PaymentClient.java
- # application.yml
- # logback-spring.xml
- # what the logs look like
- # lessons learned from production
- # lesson 1: start with correlation ids, not full tracing
- # lesson 2: MDC.clear() is non-negotiable
- # lesson 3: structured logging from day one
- # lesson 4: don't log sensitive data in mdc
- # lesson 5: sampling strategy matters
- # lesson 6: baggage has overhead
- # lesson 7: test your mdc propagation
- # lesson 8: monitor your tracing infrastructure
- lesson 9: use trace ids in error responses
- # lesson 10: invest in dashboards
- # conclusion